如何构建知识图谱
在本指南中,我们将探讨基于非结构化文本构建知识图谱的基本方法。构建好的图谱随后可用作 RAG 应用中的知识库。
⚠️ 安全须知 ⚠️
构建知识图谱需要执行数据库写入操作。这其中存在固有风险。请确保在导入数据前进行验证和确认。有关常规安全最佳实践的更多信息,请参见此处。
架构
总体而言,从文本构建知识图谱的步骤包括:
- 从文本中提取结构化信息:使用模型从文本中提取结构化的图谱信息。
- 存储到图数据库中:将提取的结构化图谱信息存储到图数据库中,以便下游 RAG 应用使用。
设置
首先,获取所需软件包并设置环境变量。 在本示例中,我们将使用 Neo4j 图数据库。
%pip install --upgrade --quiet langchain langchain-neo4j langchain-openai langchain-experimental neo4j
[1m[[0m[34;49mnotice[0m[1;39;49m][0m[39;49m A new release of pip is available: [0m[31;49m24.0[0m[39;49m -> [0m[32;49m24.3.1[0m
[1m[[0m[34;49mnotice[0m[1;39;49m][0m[39;49m To update, run: [0m[32;49mpip install --upgrade pip[0m
Note: you may need to restart the kernel to use updated packages.
在本指南中,我们将默认使用 OpenAI 模型。
import getpass
import os

os.environ["OPENAI_API_KEY"] = getpass.getpass()

# Uncomment the below to use LangSmith. Not required.
# os.environ["LANGSMITH_API_KEY"] = getpass.getpass()
# os.environ["LANGSMITH_TRACING"] = "true"
········
接下来,我们需要定义 Neo4j 的凭证和连接。 请按照此处的安装步骤来设置 Neo4j 数据库。
import os

from langchain_neo4j import Neo4jGraph

os.environ["NEO4J_URI"] = "bolt://localhost:7687"
os.environ["NEO4J_USERNAME"] = "neo4j"
os.environ["NEO4J_PASSWORD"] = "password"

graph = Neo4jGraph(refresh_schema=False)
LLM 图表转换器
从文本中提取图表数据能够将非结构化信息转化为结构化格式,从而有助于更深入地洞察和更有效地浏览复杂的关系和模式。LLMGraphTransformer 通过利用 LLM 来解析和分类实体及其关系,将文本文档转换为结构化图表文档。LLM 模型的选择通过决定提取的图表数据的准确性和细微差别,对输出产生重大影响。
import os

from langchain_experimental.graph_transformers import LLMGraphTransformer
from langchain_openai import ChatOpenAI

llm = ChatOpenAI(temperature=0, model_name="gpt-4-turbo")

llm_transformer = LLMGraphTransformer(llm=llm)
现在我们可以传入示例文本并检查结果。
from langchain_core.documents import Document

text = """
Marie Curie, born in 1867, was a Polish and naturalised-French physicist and chemist who conducted pioneering research on radioactivity.
She was the first woman to win a Nobel Prize, the first person to win a Nobel Prize twice, and the only person to win a Nobel Prize in two scientific fields.
Her husband, Pierre Curie, was a co-winner of her first Nobel Prize, making them the first-ever married couple to win the Nobel Prize and launching the Curie family legacy of five Nobel Prizes.
She was, in 1906, the first woman to become a professor at the University of Paris.
"""
documents = [Document(page_content=text)]
graph_documents = await llm_transformer.aconvert_to_graph_documents(documents)
print(f"Nodes:{graph_documents[0].nodes}")
print(f"Relationships:{graph_documents[0].relationships}")
Nodes:[Node(id='Marie Curie', type='Person', properties={}), Node(id='Pierre Curie', type='Person', properties={}), Node(id='University Of Paris', type='Organization', properties={})]
Relationships:[Relationship(source=Node(id='Marie Curie', type='Person', properties={}), target=Node(id='Pierre Curie', type='Person', properties={}), type='MARRIED', properties={}), Relationship(source=Node(id='Marie Curie', type='Person', properties={}), target=Node(id='University Of Paris', type='Organization', properties={}), type='PROFESSOR', properties={})]
检查下图,以便更好地理解生成知识图的结构。
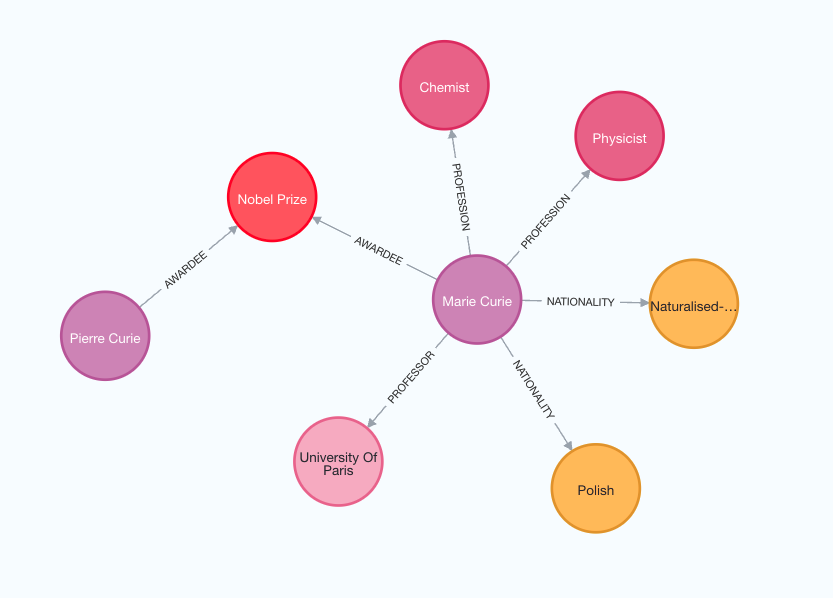
请注意,由于我们使用的是 LLM,图的构建过程是非确定性的。因此,您每次执行的结果可能会略有不同。
此外,您可以根据自己的需求灵活定义要提取的节点和关系的特定类型。
llm_transformer_filtered = LLMGraphTransformer(
    llm=llm,
    allowed_nodes=["Person", "Country", "Organization"],
    allowed_relationships=["NATIONALITY", "LOCATED_IN", "WORKED_AT", "SPOUSE"],
)
graph_documents_filtered = await llm_transformer_filtered.aconvert_to_graph_documents(
    documents
)
print(f"Nodes:{graph_documents_filtered[0].nodes}")
print(f"Relationships:{graph_documents_filtered[0].relationships}")
Nodes:[Node(id='Marie Curie', type='Person', properties={}), Node(id='Pierre Curie', type='Person', properties={}), Node(id='University Of Paris', type='Organization', properties={})]
Relationships:[Relationship(source=Node(id='Marie Curie', type='Person', properties={}), target=Node(id='Pierre Curie', type='Person', properties={}), type='SPOUSE', properties={}), Relationship(source=Node(id='Marie Curie', type='Person', properties={}), target=Node(id='University Of Paris', type='Organization', properties={}), type='WORKED_AT', properties={})]
为了更精确地定义图谱 schema,可以考虑使用三元组(three-tuple)的方法来表示关系。在这种方法中,每个三元组包含三个元素:源节点(source node)、关系类型(relationship type)和目标节点(target node)。
allowed_relationships = [
    ("Person", "SPOUSE", "Person"),
    ("Person", "NATIONALITY", "Country"),
    ("Person", "WORKED_AT", "Organization"),
]

llm_transformer_tuple = LLMGraphTransformer(
    llm=llm,
    allowed_nodes=["Person", "Country", "Organization"],
    allowed_relationships=allowed_relationships,
)
graph_documents_filtered = await llm_transformer_tuple.aconvert_to_graph_documents(
    documents
)
print(f"Nodes:{graph_documents_filtered[0].nodes}")
print(f"Relationships:{graph_documents_filtered[0].relationships}")
Nodes:[Node(id='Marie Curie', type='Person', properties={}), Node(id='Pierre Curie', type='Person', properties={}), Node(id='University Of Paris', type='Organization', properties={})]
Relationships:[Relationship(source=Node(id='Marie Curie', type='Person', properties={}), target=Node(id='Pierre Curie', type='Person', properties={}), type='SPOUSE', properties={}), Relationship(source=Node(id='Marie Curie', type='Person', properties={}), target=Node(id='University Of Paris', type='Organization', properties={}), type='WORKED_AT', properties={})]
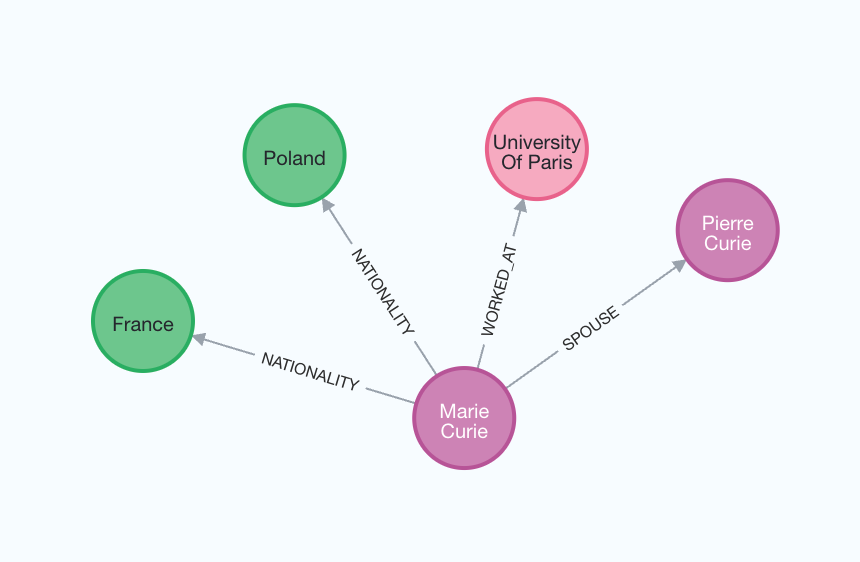
为了更好地理解生成的图,我们可以再次对其进行可视化。
node_properties 参数支持提取节点属性,从而创建更详细的图。
当设置为 True 时,LLM 会自主识别并从文本中提取相关的节点属性。
反之,如果 node_properties 被定义为字符串列表,LLM 将仅检��索文本中指定的属性。
llm_transformer_props = LLMGraphTransformer(
    llm=llm,
    allowed_nodes=["Person", "Country", "Organization"],
    allowed_relationships=["NATIONALITY", "LOCATED_IN", "WORKED_AT", "SPOUSE"],
    node_properties=["born_year"],
)
graph_documents_props = await llm_transformer_props.aconvert_to_graph_documents(
    documents
)
print(f"Nodes:{graph_documents_props[0].nodes}")
print(f"Relationships:{graph_documents_props[0].relationships}")
Nodes:[Node(id='Marie Curie', type='Person', properties={'born_year': '1867'}), Node(id='Pierre Curie', type='Person', properties={}), Node(id='University Of Paris', type='Organization', properties={}), Node(id='Poland', type='Country', properties={}), Node(id='France', type='Country', properties={})]
Relationships:[Relationship(source=Node(id='Marie Curie', type='Person', properties={}), target=Node(id='Poland', type='Country', properties={}), type='NATIONALITY', properties={}), Relationship(source=Node(id='Marie Curie', type='Person', properties={}), target=Node(id='France', type='Country', properties={}), type='NATIONALITY', properties={}), Relationship(source=Node(id='Marie Curie', type='Person', properties={}), target=Node(id='Pierre Curie', type='Person', properties={}), type='SPOUSE', properties={}), Relationship(source=Node(id='Marie Curie', type='Person', properties={}), target=Node(id='University Of Paris', type='Organization', properties={}), type='WORKED_AT', properties={})]
存储到图数据库
生成的图文档可以使用 add_graph_documents 方法存储到图数据库中。
graph.add_graph_documents(graph_documents_props)
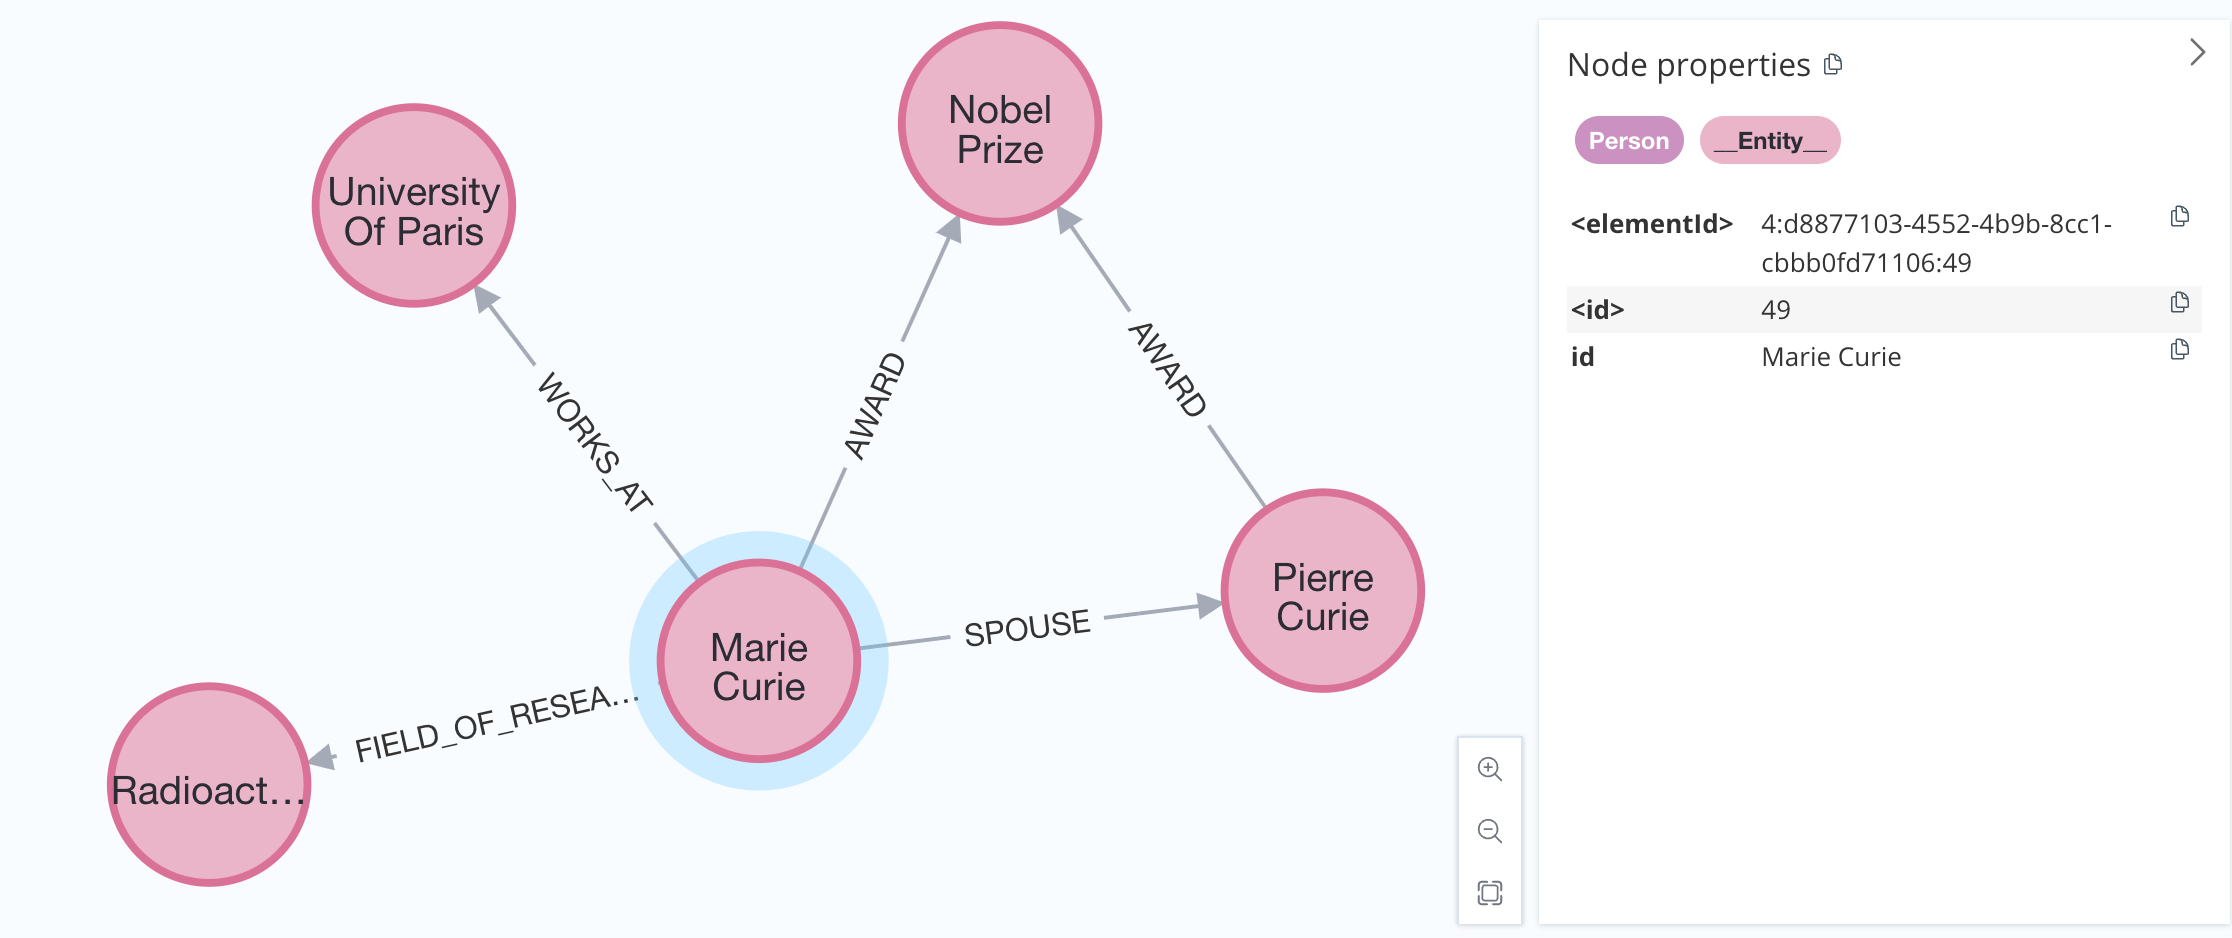
大多数图数据库都支持索引来优化数据导入和检索。由于我们可能无法预先知道所有的节点标签,我们可以通过 baseEntityLabel 参数为每个节点添加一个次要的基础标签来处理这个问题。
graph.add_graph_documents(graph_documents, baseEntityLabel=True)
结果将如下所示:
最后一个选项是同时导入提取的节点和关系的源文档。这种方法使我们能够跟踪每个实体出现在哪些文档中。
graph.add_graph_documents(graph_documents, include_source=True)
图将具有以下结构:
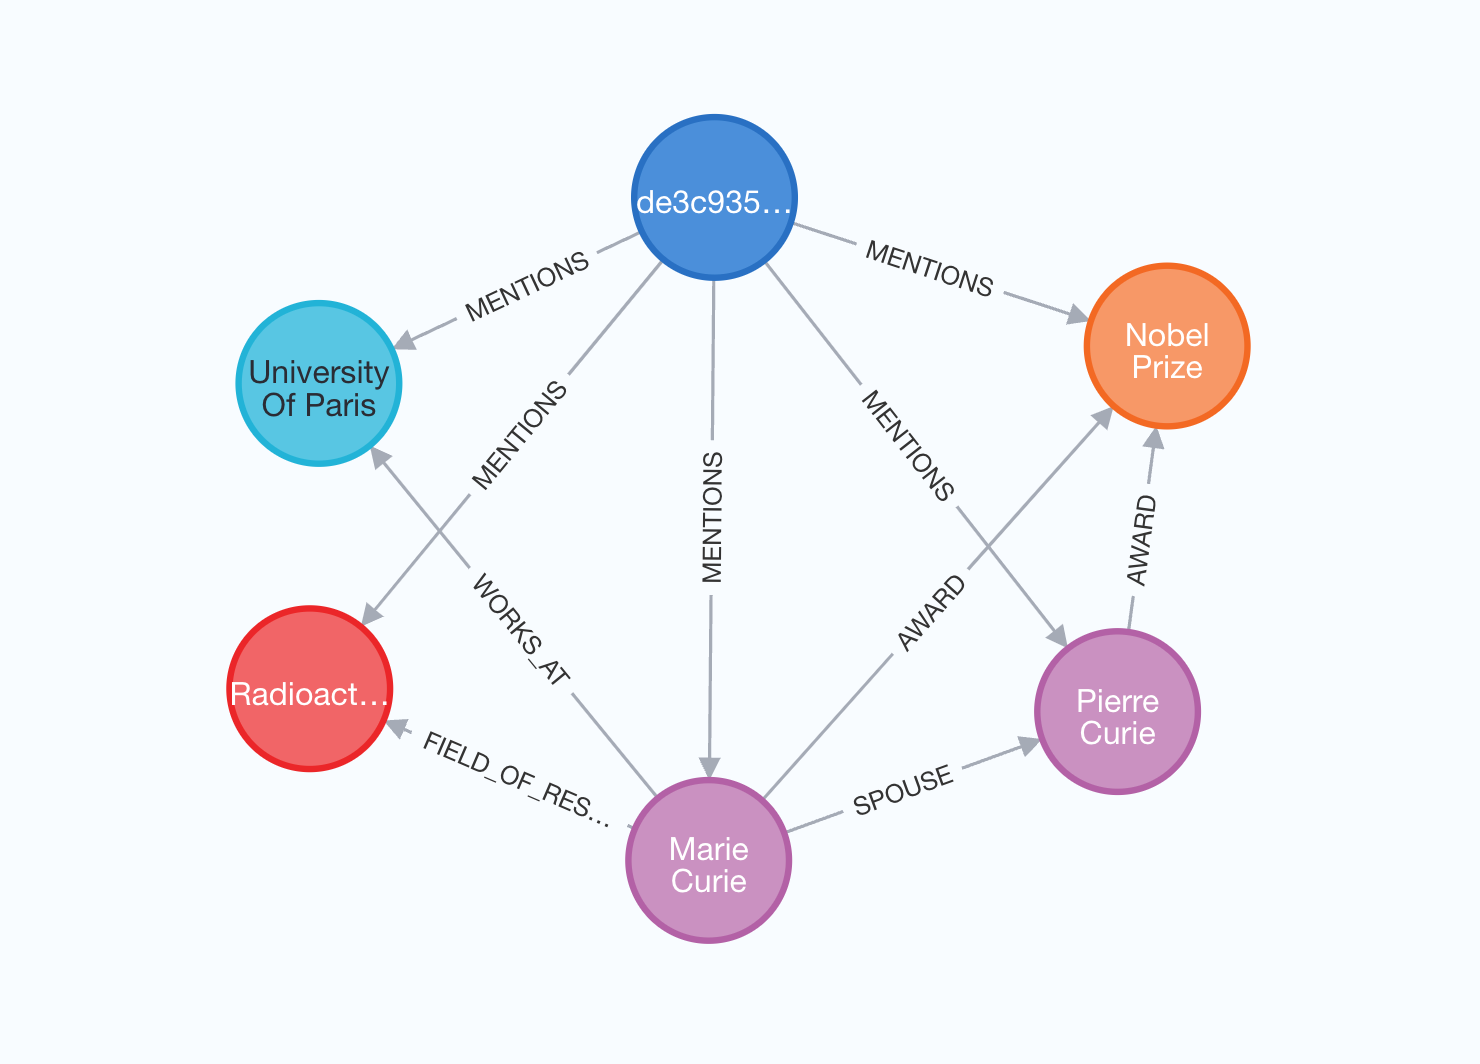
在此可视化中,源文档以蓝色突出显示,从中提取的所有实体都通过 MENTIONS 关系连接。